|
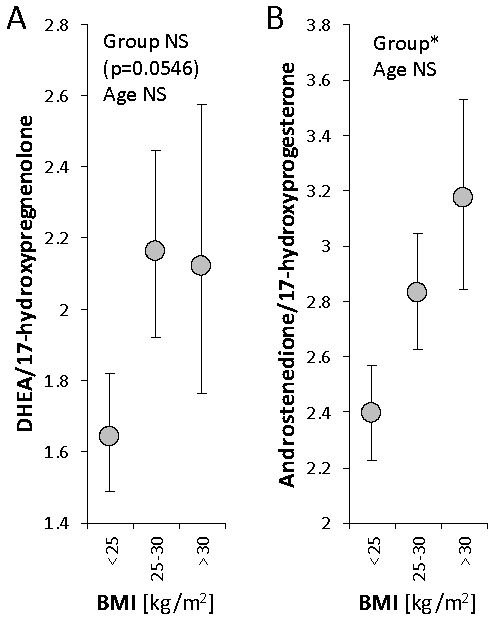
| Figure 5: Relationships between steroid ratios reflecting the activity of C17-hydroxylase, C17,20-lyase (CYP17A1) and BMI as evaluated using ANCOVA with BMI group as a main factor and age of the subject as a covariate (for details see statistical data analysis). The circles with error bars represent the group means with their 95% confidence intervals as computed for least significant difference (LSD) multiple comparisons (p=0.05). The confidence, which do not overlap represent statistical significant difference between the corresponding groups. Statistical significance: NS=not significant, *p<0.05. |