|
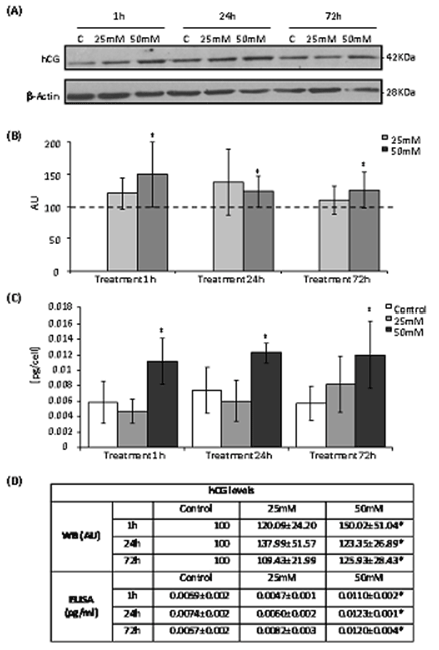
| Figure 3: Effects of ethanol treatments in JEG3 cells HOG production. {A} Representative Western blot detecting IGF2. {B} Columns show the mean ± SD of 25 mM and 50 mM groups normalized against the control group, represented as a discontinuous line {100AU}. Results are expressed as arbitrary units {AU}. {C} columns show the mean ± SD HOG content in JEG3 cells culture medium from the three groups measured by ELISA. Results are expressed as pg/cell. {D} Western blot and ELISA results for each group. *p<0.005 vs. control. |