 |
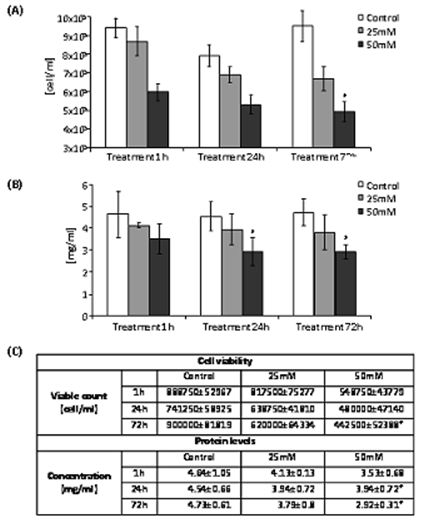
| Figure 4: Viable cell count after treatment and total protein quantification in JEG3 cells exposed to ethanol. {A} Cell number {mean ± SD} assessed by trypan blue exclusion method in the three groups. Results are expressed as arbitrary units cell/ml. {B} Total protein {mean ± SD} measured with DC protein Assay in the three groups. Results are expressed as mg/ml. {C} viable count and protein quantification results. *p<0.005 vs. control. |