 |
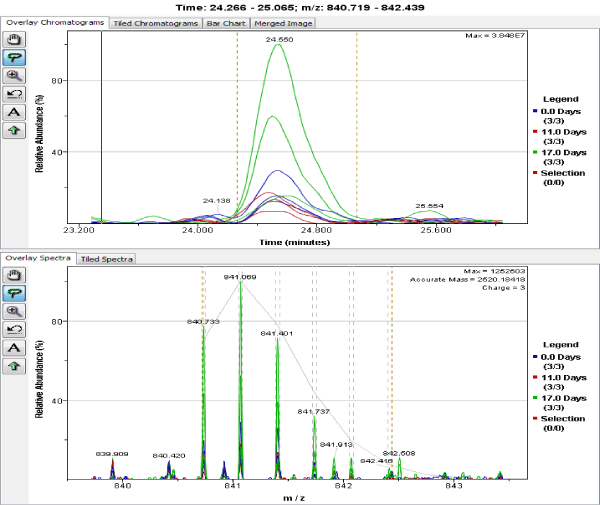
| Figure 1: An Example of Aligned Mass Data: An example of aligned peptide signals for the data set is presented here: a) Sample labels: Figures are color-coded according to sample group. Selection (red) references an option to manually select a single sample to be highlighted. This option was not selected; b) Top panel: Extracted ion chromatogram for m/z 840.719-842.439 from retention time 24.266-25.065 minutes demonstrates retention time alignment across all samples for this signal; c) Bottom panel: Aligned masses in the mass range of 840.733-842.416 for all samples in the study set. |