 |
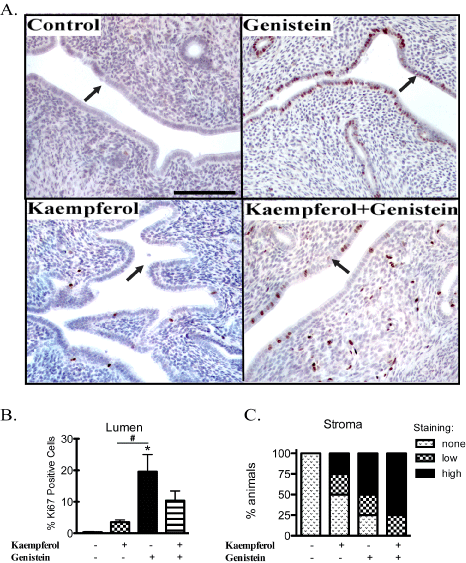
| Figure 2: Cell proliferation in response to oral treatment with vehicle (control), genistein, kaempferol and genistein+kaempferol in OVX rat uteri. Representative sections of uterus immunostained for Ki67 (A). Results are represented as percentage of Ki67 positive cells in the luminal epithelium (B). In the stroma, Ki67 staining was categorized as low, medium or high, and shown as percentage of animals from each category (C). Data represented as mean ± SEM of Ki67 positive cells (n = 4 per group). *p < 0.05, significantly different from control, #p < 0.05, significantly different between groups. Scale bar=100 μm. |