 |
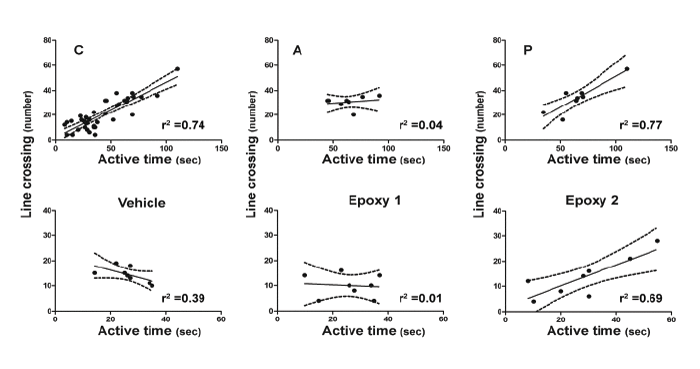
| Figure 3: Correlation between Line crossing and Active time behavioral parameters, under all conditions together (C) or for each microinfusion treatment (Vehicle, A: allopregnanolone, P: pregnanolone, Epoxy 1 and Epoxy 2 ). Each point represents a value corresponding to an individual animal test. Correlation coefficients are showed in each panel. Significant effects were determined by one-way ANOVA: FC(1,40)=108.2; p<0.0001, FVehicle(1,6)=3.9; p=0.09, FA(1,6)=0.3; p=0.62, FP(1,6)=20.5; p=0.004, FEpoxy 1(1,6)=0.1; p=0.82 and FEpoxy 2 (1,6)=19.6; p=0.01, sub index in each F indicates the treatment analyzed. Dotted lines indicate the 95% confidence intervals. |