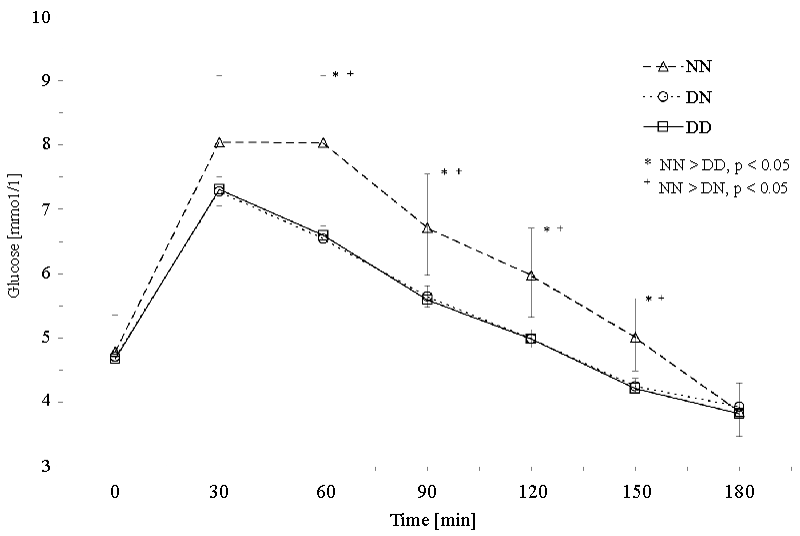
 Evaluated by repeated measures ANOVA model with Bonferroni correction; error bars represent transformed means for NN, DN, and DD genotypes with their 95%
confidence intervals
 Evaluated by repeated measures ANOVA model with Bonferroni correction; error bars represent transformed means for NN, DN, and DD genotypes with their 95%
confidence intervals
 |
| Figure 1: SHBG polymorphism rs6259 and stimulated glucose levels during the 3h-oGTT. |