 |
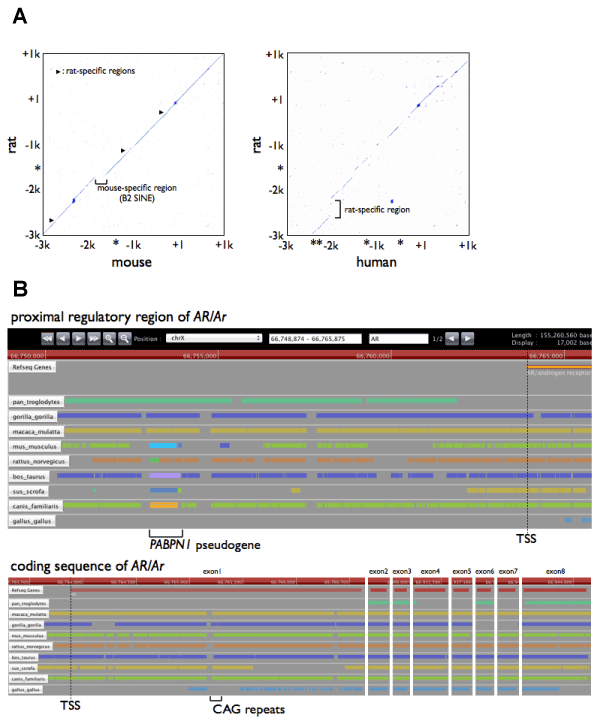
| Figure 3: Divergence of the 5’-flanking sequences of AR/Ar. A. Dot plot of the mouse Ar and human AR relative to the rat Ar locus. In this plot, sequences with high similarity were plotted in a 50-bp window. B. Sequence comparison of 5’ region (-15 kb to +2 kb) and CDS of AR/Ar across species using the BLASTZ algorithm. Data were visualized with the software GenomeJACK (http://www.mss.co.jp/businessfield/bioinformatics/solution/products/genomejack/index.html). Each colored bar in the row for the indicated species represents a particular chromosome where the sequence best matched to the human genomic sequence in the red bar is located. Asterisks denote half-sites of consensus estrogen responsive element (5’-GGTCAnnnTGACC-3’: [114]). |