 |
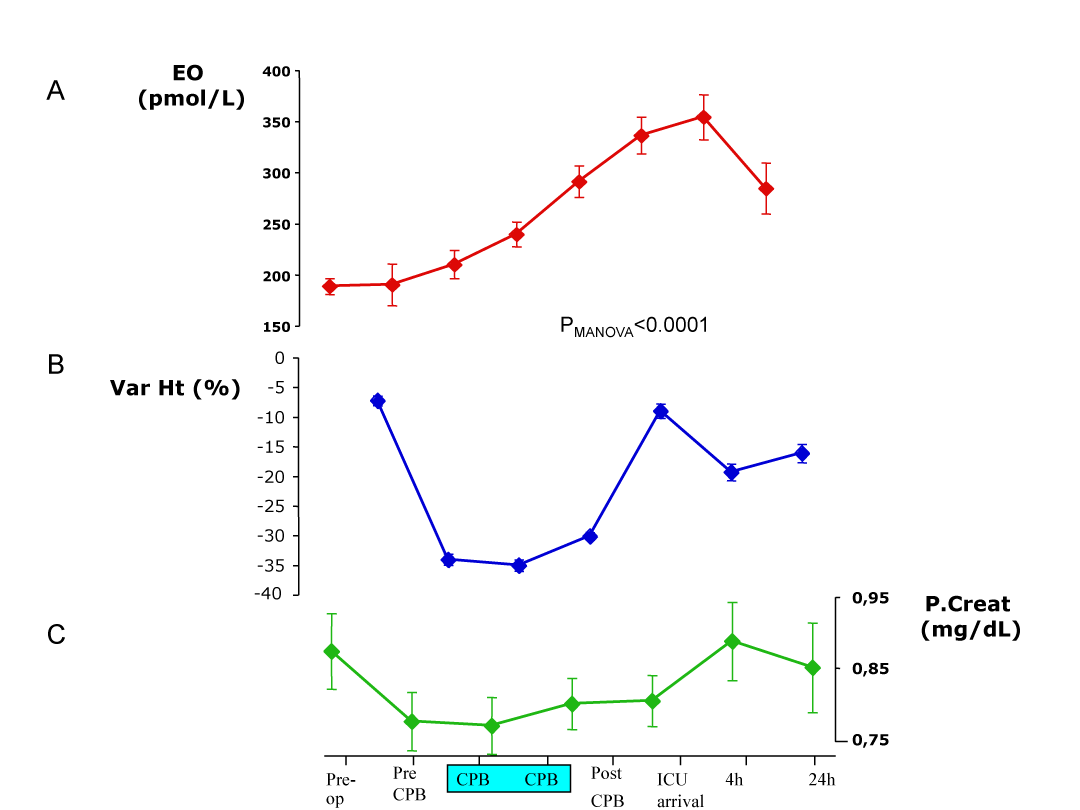
| Figure 1: EO time course during CPB. Panel A: 15 min after general anesthesia was induced plasma EO (red) start to rise achiving the maximum increase 4 hour after CBP. (MANOVA repeated measure p< 0,0001 after correction for SEX, AGE, BMI, Euroscore). Panel B: the haematocrit (bleu) expressed as variation percent (Var Ht (%)), decrease 35% from baseline suggesting an acute volume espansione before CEC. Panel C: plasma creatinine (green) durino volume expansion decresed as consequece of plasma diulution. |