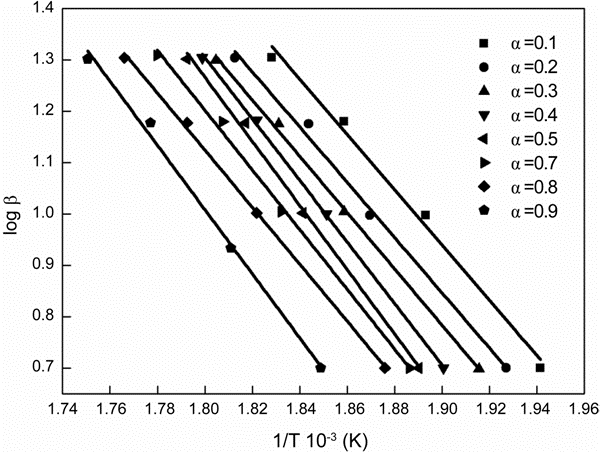
Figure 5:
OFW plots of (a) PHB/CNC (1%) and (b) PHBCNC (5%) nanocomposites at different conversions obtained from multiple heating rate TGA curves.