 |
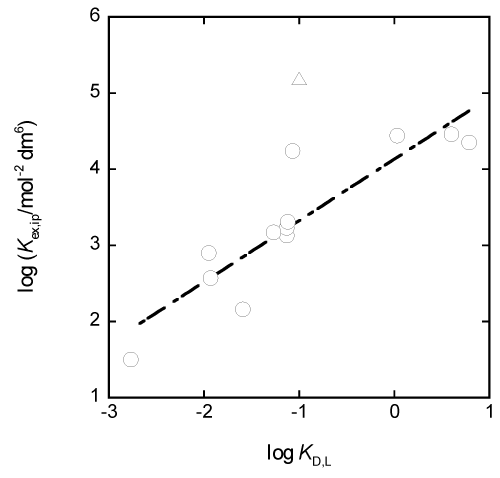
| Figure 3: Plot of log Kex,ip versus log KD,L at L=18C6. The circles show points of the oDCBz, BBz, DBE, Bz, 1-chlorobutane [1], chloroform [1], 1,2-dichloroethane [1], dichloromethane [1], chlorobenzene [1], toluene [1], and m-xylene [1] extraction systems andthedotted line shows a regression one based on log Kex,ip=(VMLA2/VL)log KD,L+log K1K2+[the constant term] (see text). The triangle shows the point of the NB extraction system. |