 |
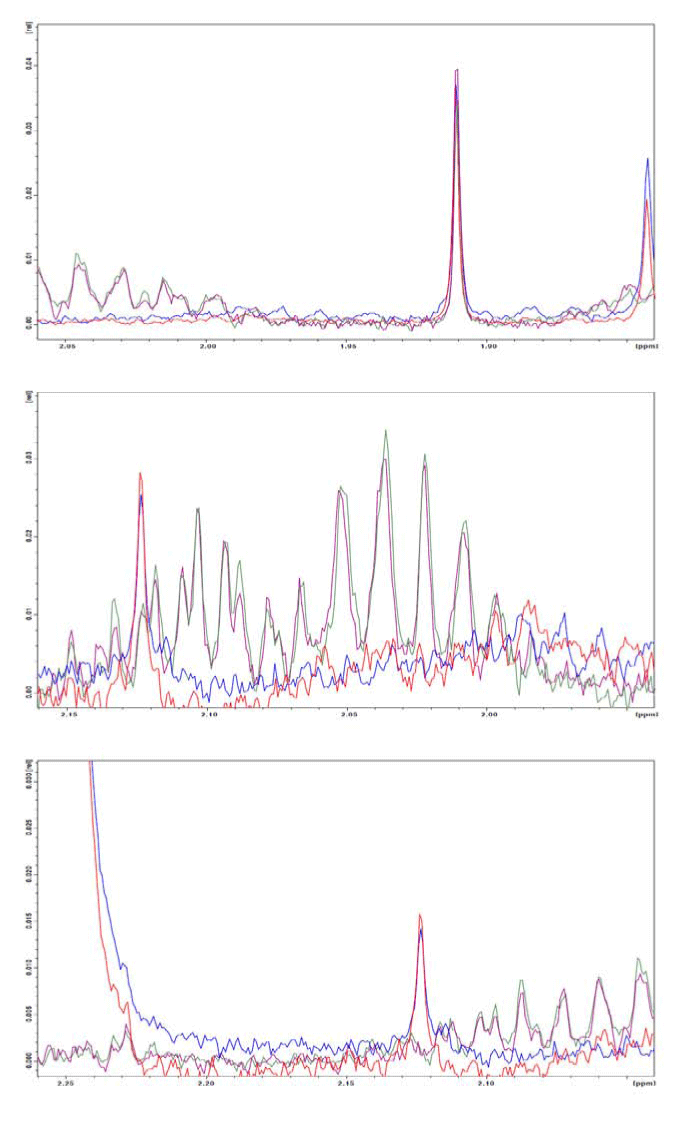
| Figure 4:Superposition of randomly chosen spectra (healthy subjects in red and blue, infected subjects in green and violet) showing the difference as identified by the PCA at 1.86 ppm (citrulline),1.92 ppm (lisine, arginine and acetate), 2.04 ppm (glycoproteins), 2.05 ppm (proline), 2.08/2.09 ppm (glutamine), 2.13 ppm (metionine), 2.15 ppm (glutamate) and 2.24 ppm (valine). |