 |
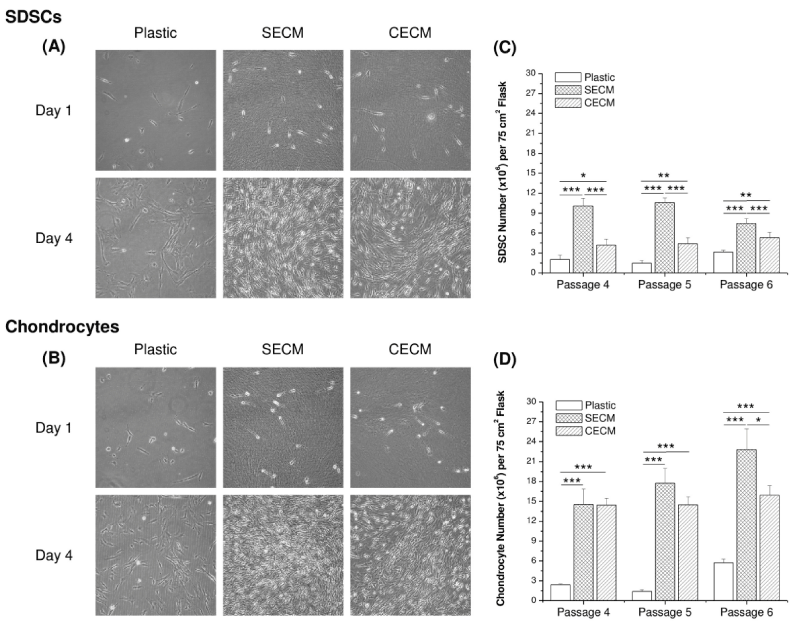
| Figure 2: SECM and CECM induces expanded SDSC (A) and chondrocyte (B) morphology change at days 1 and 4; expanded cell number of SDSCs (C) and chondrocytes (D) from passage 4 to passage 6 was quantitatively compared when seeded on Plastic, SECM, and CECM. Significant differences are indicated as follows: * = p < 0.05; ** = p < 0.01; and *** = p < 0.001. Data are shown as average ± SD for n = 4. |