 |
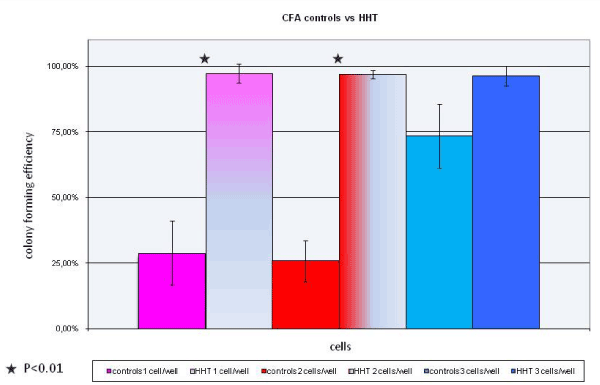
| Figure 1: Bar chart of colony forming assay: pink 1 cell/well control cells, pink/grey 1 cell/well HHT cells, red 2 cells/well control cells, red/grey 2 cells/ well HHT cells, light blue 3 cells/well control cells and blue 3 cells/well HHT cells. P<0.01. |