 |
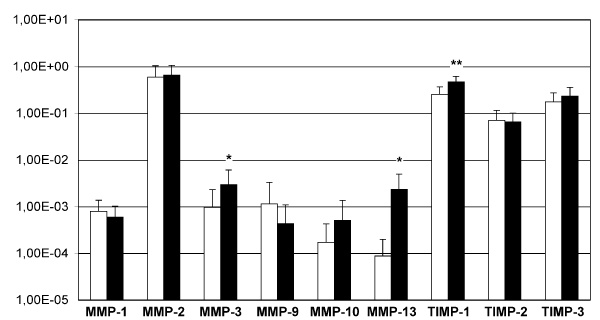
| Figure 1: TGF-β1-regulated transcript levels of MMPs and TIMPs. MSC were stimulated by TGF-β1 (10 ng/mL, 24 h, black bars) or left untreated (white bars). The transcript levels encoding MMPs and TIMPs were measured by qRT-PCR and normalized to the expression levels of GAPDH. Basal expression of MMP-2, TIMP-1, -2, and -3 was higher compared to the other MMPs. TGF-β1 elevated the mRNA expression of MMP-3 (p<0.05), MMP-13 (p<0.05), and MMP-10 (n.s.). TIMP-1 transcripts were raised as well (p<0.01), whereas the mRNA levels of MMP-1, MMP-9, TIMP-2, and TIMP-3 either dropped or remained unchanged. The results epresent the mean values ± SD (n≥7 donors) of the mRNA transcript levels of the indicated MMPs and TIMPs in MSC. Asterisks indicate significance (* p≤0.05 / ** p≤0.01) of activated cells vs. controls without TGF-β1 stimulation. |