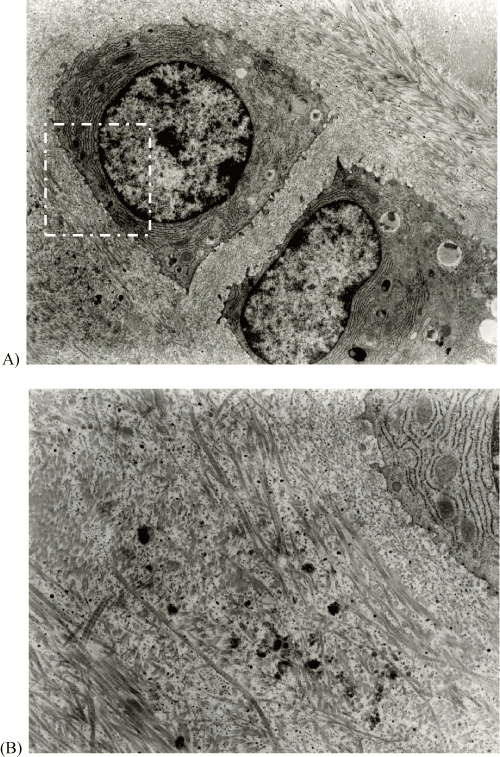
(A) Normal cartilage with chondrocytes. 4,000X.
(B) Territorial and interterritorial matrix of normal chondrocytes. 10, 000X.
 |
| Figure 7: Photograph of electron microscope image of normal cartilage. (A) Normal cartilage with chondrocytes. 4,000X. (B) Territorial and interterritorial matrix of normal chondrocytes. 10, 000X. |