 |
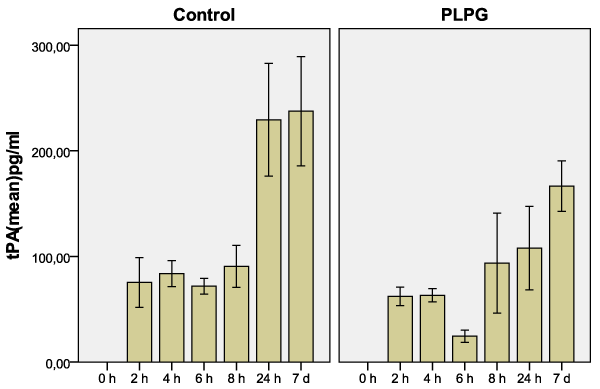
| Figure 1: Peritoneal concentrations of tPA (pg/ml) in controls (NaCl) and experimental group (PL/PG) before (0h) and after surgery (2h-7d) No significant difference in concentrations were seen between the PL/PG group and controls as a total. A significant difference in tPA concentration between PL/PG and controls were seen at 6h (p=0.002). Graphs show tPA concentration ±SE. |