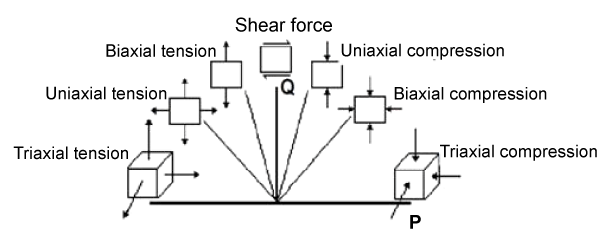
Figure 7:
P-Q (Longitudinal-Transversal) curve defining the stress state of a structure under typical loading conditions on AF tissue. The lines originating from P = Q = 0 depicted on this plot, showing the specific loading conditions [6,7].