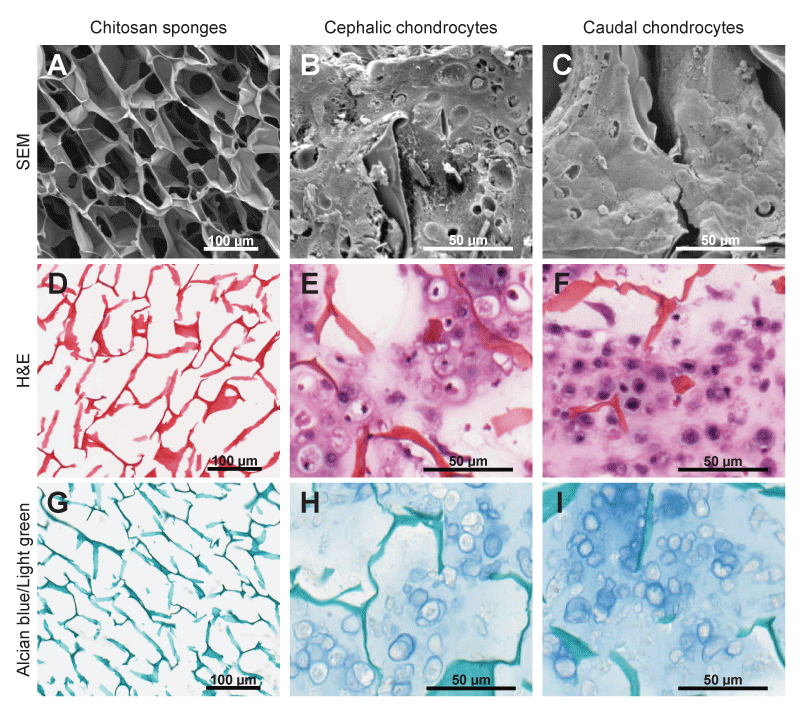
Histological cross sections of sponges collected after 10 days in culture were visualized by SEM (A, B, C), H&E (D, E, F), and alcian blue to visualize proteoglycans in the matrix (G, H, I). Some hypertrophic chondrocytes can be identified in the cultures of CP cells (compare E to F).