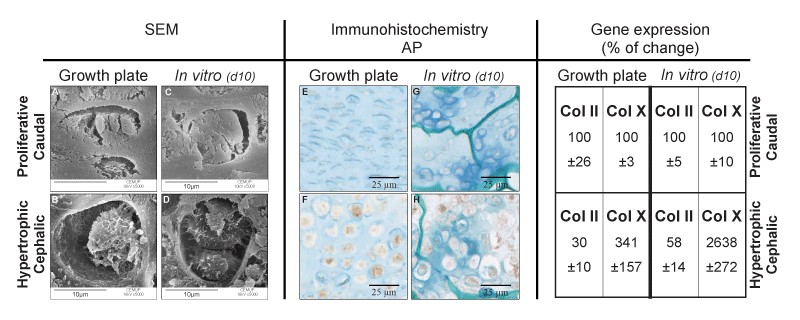
CP and CD chondrocytes were cultured for 10 days in chitosan sponges, and samples collected for SEM, ALP immunostaining and Real time RT-PCR, using primers specific for chick genes. 19 day chick embryo tibia growth plates were analyzed in the same manner. Note the similar morphology of chondrocytes in the growth plate, and in the chitosan. Positive ALP staining is present in hypertrophic chondrocytes in the growth plate and CP cells in culture. Gene expression profiles are also similar in hypertrophic cells in the growth plate and the CP cells in culture. Expression levels are presented as “fold change” in mRNA levels in CP chondrocytes, when compared to CD chondrocytes or hypertrophic chondrocytes compare to proliferative. All values were significantly different.