 |
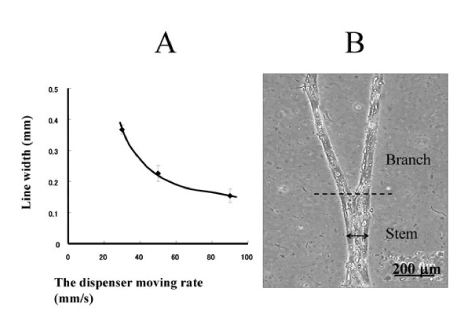
| Figure 11: (A) Line width of cell dispensing region vs. dispenser movement rate. (B) Y-shaped cell deposition pattern. Dispenser movement rates were 50 mm/s (A) and 90 mm/s (B) at stem and branch regions, respectively. Valve-opening ratio, 3 %; injection pressure, 0.05 MPa; injection time, 4 s; concentration of cells, 1×10⁷ cells/ml. |