 |
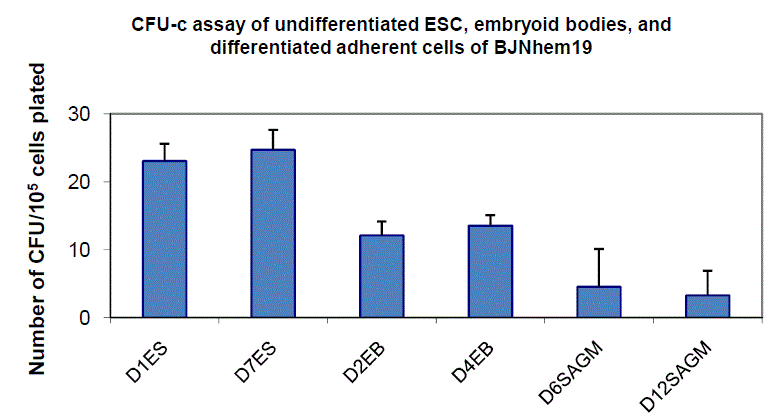
| Figure 11A: CFU-c (colony forming assay counts at day 7 of BJNhem20 in methyl cellulose with SCF-1 in IMDMundifferentiated ES, EBs and differentiated in SAGM (BJNhem 19). Details of procedure outlined in Materials and Methods section. The presented graphs represent number of colonies formed per).1 million cells plated in the semi-solid 3D matrix of methyl-cellulose supplemented with IMDM and SCF. CFU-c at day 7 of BJNhem20 in methyl cellulose with SCF-1 in IMDM- undifferentiated ES, EBs and differentiated in SAGM (BJNhem 20). Y-axis represents number of days in culture in varying media and differnetial attachment templates. |