 |
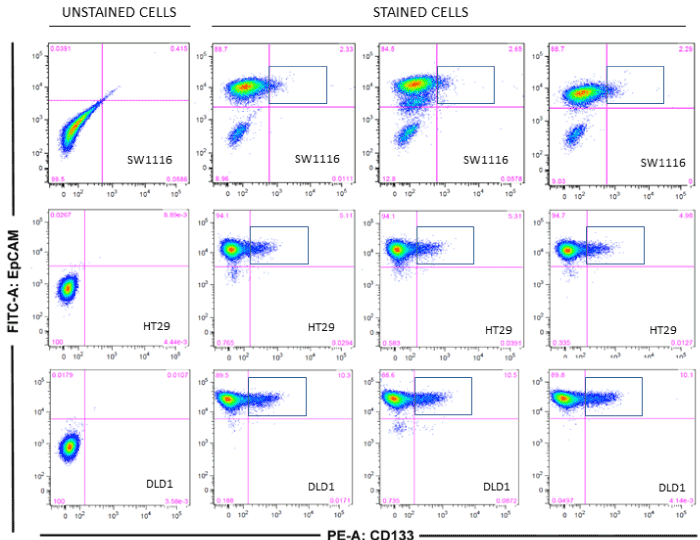
| Figure 1: Dot plots showing increasing co-expression of CD133 and EpCAM in SW1116 (Dukes stage A), HT29 (Dukes stage B) and DLD1 (Dukes stage C) cell lines. Cells co-expressing CD133 and EpCAM (upper right quadrants in each stained dot plot) may represent CSC populations. Unstained cells were used to position quadrant gates (left column of dot plots) for each cell line and co-expression of CD133 and EpCAM was determined by staining with anti-CD133 (PE) and anti-EpCAM (FITC) antibodies. Each cell line was stained in triplicate. |