 |
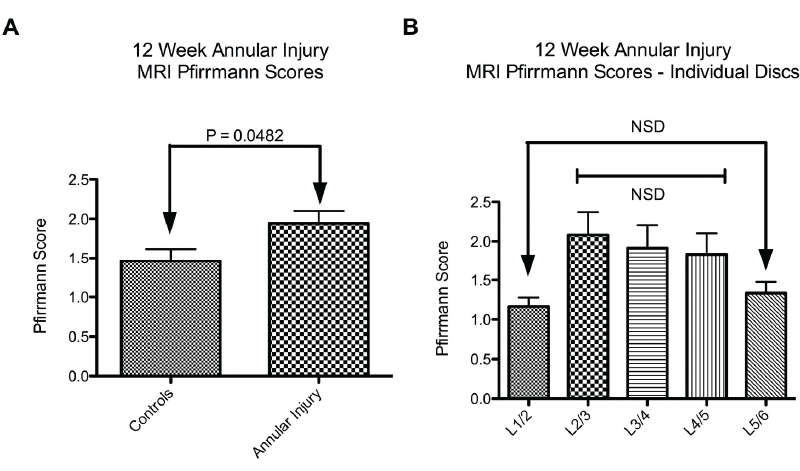
| Figure 3: Panel A: Comparison of the mean Pfirrmann MRI scores for the control discs and all injured discs 12 weeks post-surgery. Scores for the operated discs were significantly higher than for the combined uninjured Controls (2.0 versus 1.0, P=0.0482). Panel B: Mean Pfirrmann MRI scores for the indivual control and injured discs 12 weeks PO. No statistical Differences in scores were observed between the two control discs (L1/2 and L5/6), nor between the three discs subjected to annular incision (L2/3, L3/4, L4/5). |