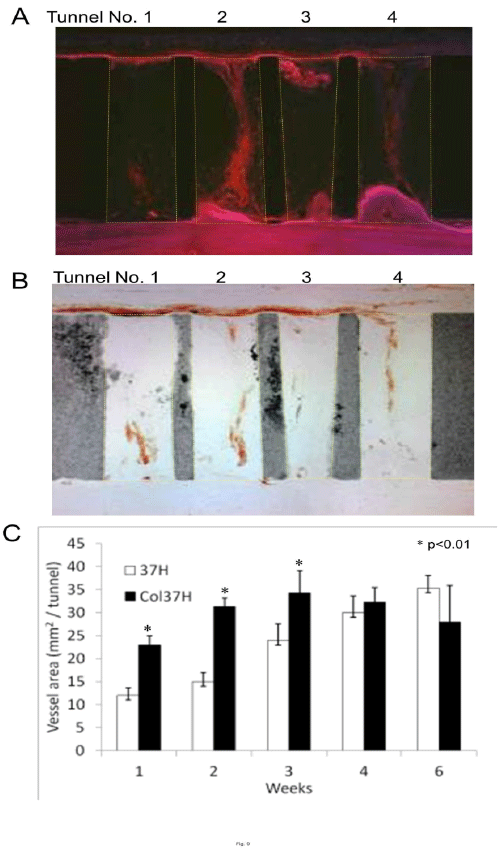
(B) A light microscope photograph showing angiogenesis in tunnels stained with VEGF on same section of A.
(C) A comparison (mm2/tunnel) of the area of angiogenesis (stained brown) per tunnel (inside of each yellow-dotted line) in 37H and Col37H (*p<0.01).