|
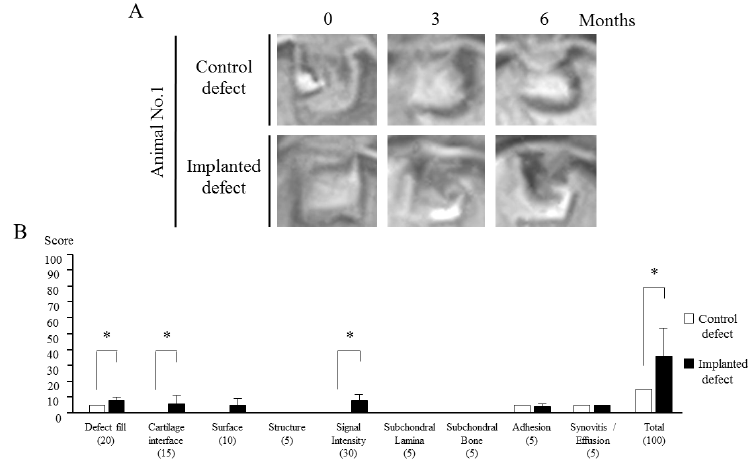
| Figure 3: MR images of the osteochondral defects (A) and modified 2D-MOCART scores of osteochondral defects (B). MR images show one cross-section of the multiplanar reconstruction images one, three, and six months after surgery in animal No.1 as a representative of all of the animals (A). MR image in the implanted site of animal No. 1 showed that the articular cartilage was almost restored the normally-detected signal intensity of the surrounding sound cartilage, whereas the new bone formation under the cartilaginous tissue was incomplete. There were significant differences (asterisks) in the outcome measures such as defect fill, cartilage interface, signal intensity, and the total scores between the implanted and control sites (B). P<0.05 was considered to be statistically significant. |