 |
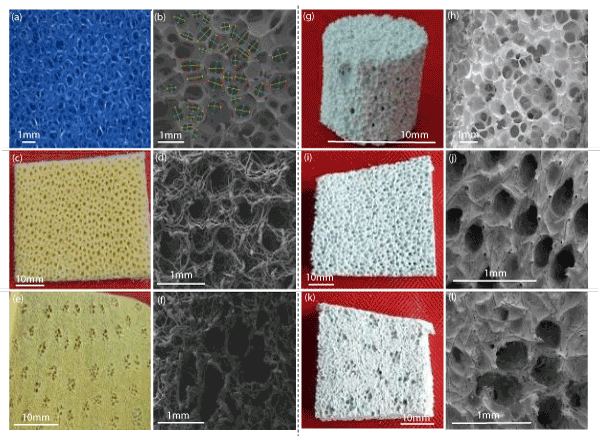
| Figure 1: (a) Polyurethane foam (60PPI) (b) Typical image analysis showing strut thickness (red), maximum distance between struts (yellow) and minimum distance between struts (blue) (c) Inhalant surface of Spongia agaricina (d) Micrograph of inhalant surface (e) Exhalent surface of Spongia agaricina (f) Micrograph of typical pore cluster on exhalent surface of Spongia agaricina (g) Replicated PU foam (h) Porous and non-porous regions of replica PU foam (i) Replicated inhalant surface of Spongia agaricina (j) Micrograph of inhalant surface (k) Replicated exhalent surface of Spongia agaricina (l) Typical pore cluster on exhalent surface of Spongia agaricina. |