|
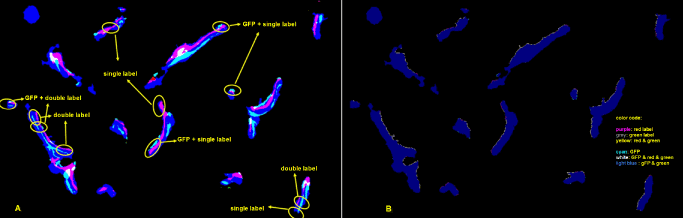
| Figure 9: (A) Segmented image inside of ROI from Figure 8A. It shows single label, double label, GFP associated with single label, GFP associated with double label. (B) Projection of the features to the surface of the bone. Each signal is projected onto the surface of the bone by morphological operation, along the calculated surface norm vectors. This projection image is the basis of all the calculated bone surface ratios. |