 |
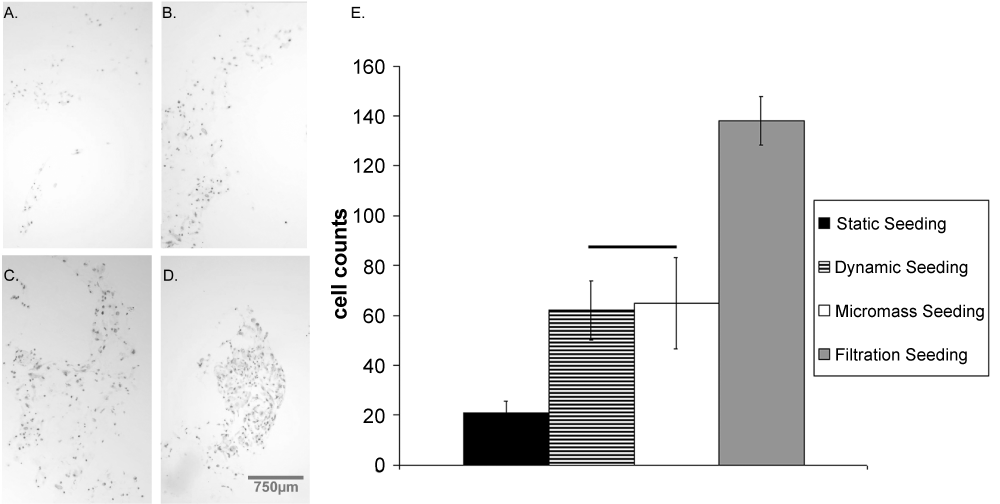
| Figure 2: Cell count and distribution varies in seeded scaffolds, 6 hours after seeding. Histological slides demonstrate the even distribution and high cell adhesion produced in scaffolds that were seeded through filtration (A). Static seeding (B) is characterized by a lower yield of cells that are un-evenly allocated throughout the sections. Dynamic seeding showed sections with densely packed cells but also a large variation in cell location (C). Micromass seeding technique was validated showing a densely packed group of cells in the core of the scaffold. Quantification of the mean cell count (E) in histological demonstrates that filtration, dynamic, and micromass seeding techniques enable more cell adhesion (p<0.001). There was no significant difference between micromass and dynamic seeding (p =0.672). Bars indicate groups that are not significantly different. |