|
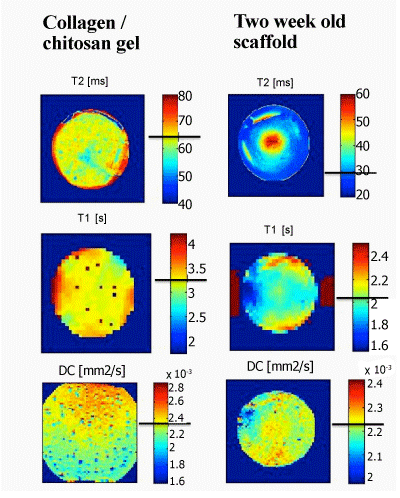
| Figure 4: T1 map, T2 map and ADC map for collagen/ chitosan polymer gel (left panel) and two week old osteogenic scaffold with extra cellular matrix of bone (right panel). The changes in parameter values are evident from the figure. The experimental parameters were: pulse sequences used MSME (T2), RAREVTR (T1) and SE with PFG for diffusion measurements (ADC). Other parameters were: FOV = 1.2 cm×1.2 cm (except for lower left figure, where it was 0.8 cm×0.8 cm), matrix size = 128×128 (T2), 32×32 (T1), 64×64 (ADC). |