|
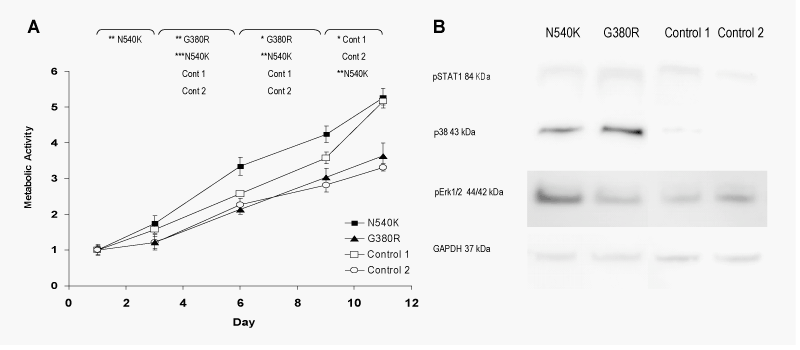
| Figure 1: Metabolic activity and affected signalling pathways. A, Metabolic activity was measured where FGFR3 mutant N540K displayed highest metabolic activity until day 11. The G380R mutant displays a similar profile as its matched control, control 2. All cell populations keep a growth curve until day 11 when confluence is reached. B, Signalling pathways affected by FGFR3 mutants indicate similar phosphorylation of STAT-1 in all cell populations. Signalling through MAPK-pathway members display elevated phosphorylation of Erk-1/2 in both mutants, significant activation in N540K. Induced phosphorylation of p38 was displayed in both N540K and G380R mutants can be seen compared to control populations. |