 |
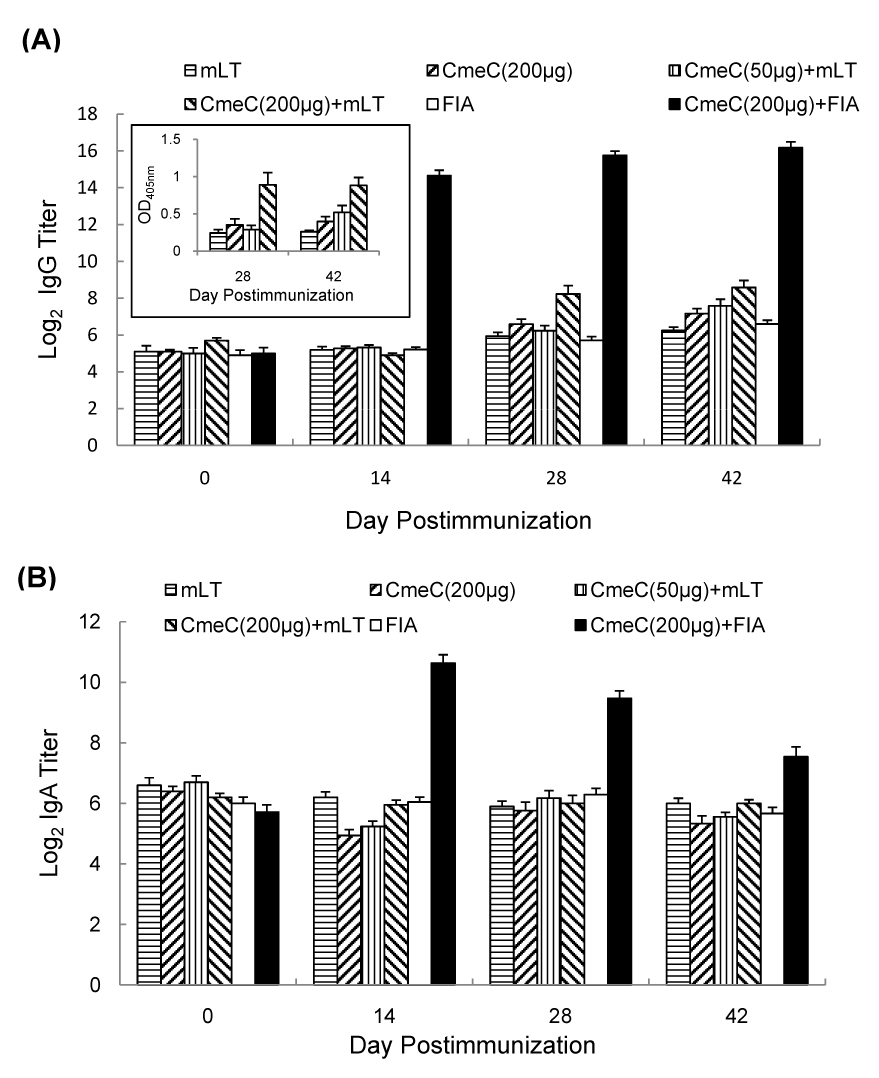
| Figure 5:Serum IgG and IgA titers to rCmeC (vaccination Trial 2). (A) Serum IgG titer in response to rCmeC subunit vaccination. The embedded figure shows the average of OD405nm readings of group A-F (Table 2) at 28 and 42 days postimmunization. (B) Serum IgA titer in response to CmeC subunit vaccination. Each bar is the average of log2 transformed titers or the standard error indicated by error bar. |