 |
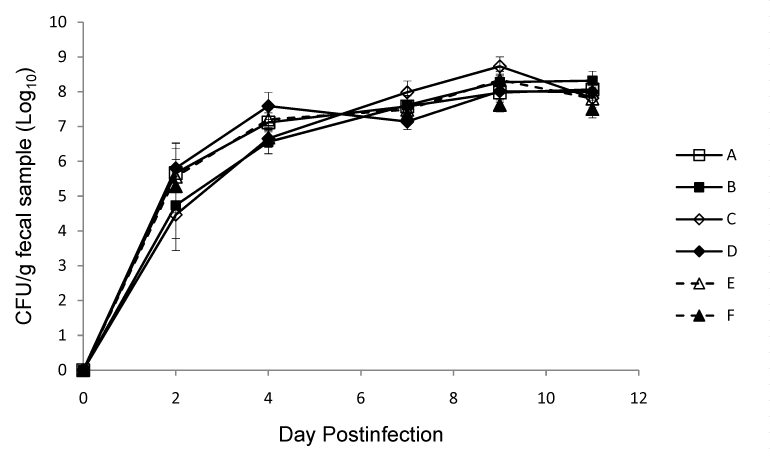
| Figure 7: Campylobacter colonization levels after challenging CmeCvaccinated chickens with C. jejuni NCTC 11168 (Trial 2). The letter for each type of point corresponds to the group described in Table 3. Each point represents mean log10 CFU/g feces ± the standard deviation in each group. |