 |
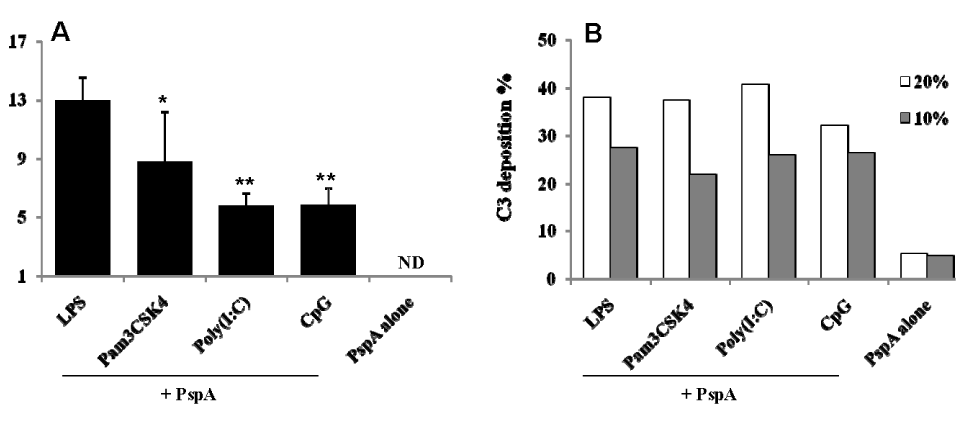
| Figure 2: Binding of IgG antibodies (A) and C3 deposition (B) on the S. pneumoniae WU2 cell surface in the presence of sera from immunized and control mice. Binding The levels of IgG were analyzed by whole cell ELISA, and the C3 deposition were analyzed by flow cytometry using S. pneumoniae WU2 cells which were incubated with 20% (open bars) or 10% (gray bars) of pooled sera from mice that were immunized by intranasal immunization with either PspA plus each TLR agonist or PspA alone. The percentage of fluorescent bacteria (greater than 10 fluorescence intensity units) is shown as C3 deposition for each sample. *p < 0.05, **p < 0.01, when compared with mice that were nasally immunized PspA plus LPS. The results are expressed as the mean ± S.D. for six mice per group. ND, not detected. |