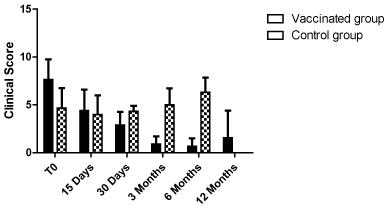
Both groups were injected at T0, 15 days and 30 days and at each time point dogs were clinically assessed for clinical score up to twelve month after first inoculation. The decrease of clinical score values was observed only in vaccinated groups whereas the control group shown a slight increase. Error bars indicate standard deviation (SD).