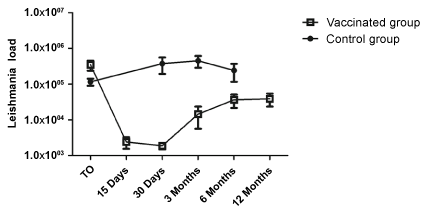
In contrast to control group the vaccinated group exhibits a reduction of parasite load since 15 days after first inoculation.
 |
| Figure 3: Evaluation of parasite load during immunotherapy. Squares
represent vaccinated group (12 dogs) while circles indicates control group
(5 dogs). Fine-needle biopsy were taken and Leishmania DNA copies was
estimated by qPCR at each time point. The axis indicates the number of
Leishmania/ml expressed in logarithmic values. In contrast to control group the vaccinated group exhibits a reduction of parasite load since 15 days after first inoculation. |