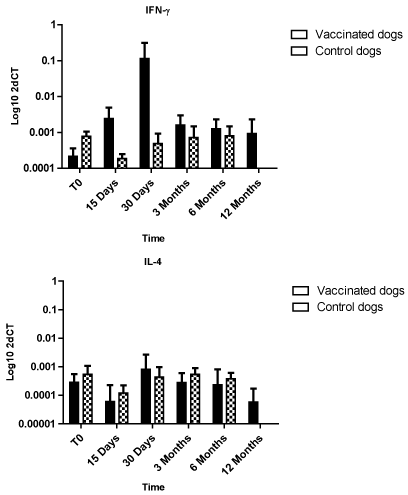
Cytokine mRNA levels in PBMC shows no relevant differences between the vaccinated and control group with the exception of the 15 days and the 30 days time point of vaccinated group that shows a significant increase of IFN-γ. Error bars indicates standard deviation (SD).