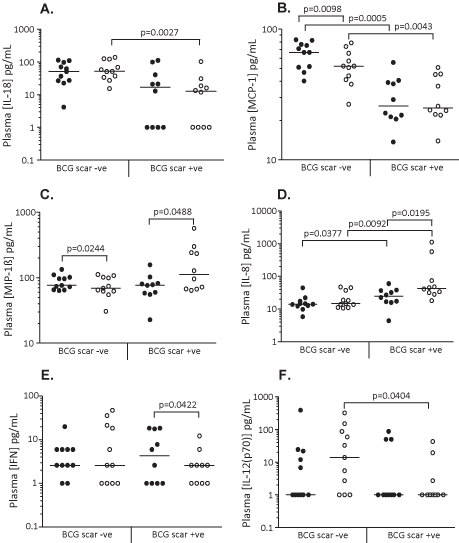
Cytokine levels were analysed within groups using a paired Wilcoxon signed rank test. Levels were compared between BCG scar positive and scar negative subjects using a Mann-Whitney U-test. Pvalues are indicated. Line = median.
 |
| Figure 1: Cytokine and chemokine concentrations of BCG scar negative and scar positive healthy adult subjects pre and post vaccination. Pre-vaccination (filled) and
post-vaccination (open). Cytokine levels were analysed within groups using a paired Wilcoxon signed rank test. Levels were compared between BCG scar positive and scar negative subjects using a Mann-Whitney U-test. Pvalues are indicated. Line = median. |