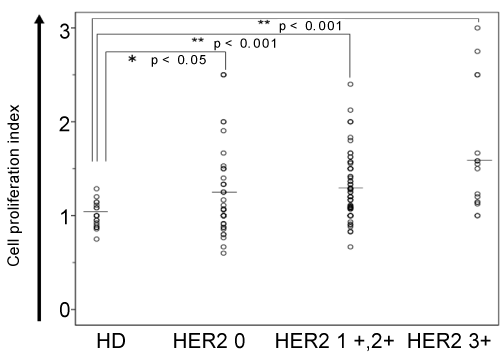
Cell proliferation index of 3 patient groups (HER2 0, HER2 1+2+, and HER2
3+) and a healthy donor group (HD) are shown. HD, healthy donors (n=22);
HER2 0, patients with HER2 expression immunohistochemistry (IHC) score
0 (n=66); HER2 1+2+, patients with HER2 expression IHC scores 1+ and 2+
(n=89); and HER2 3+, patients with HER2 expression IHC score 3+ (n=18).
Open circles represent each patient’s cell proliferation index. The solid bar
represents the mean value of each group. Significant difference between HD
and each patient group is shown with * (p<0.05) and ** (p<0.001).