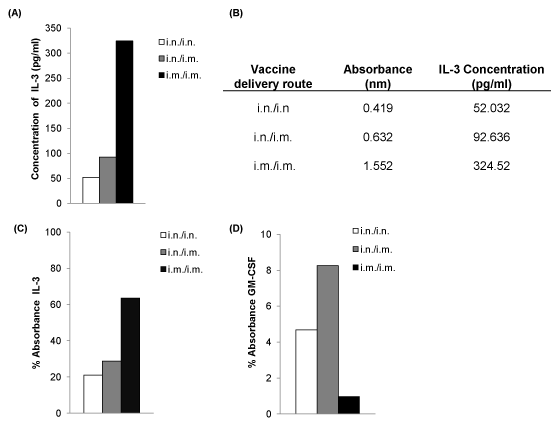
Two weeks following i.n./i.n., i.n./i.m, and i.m./i.m. prime-boost immunization, 2×10⁶ cells from pooled spleens (n=4 per group) were cultured overnight in complete RPMI, in the presence of KdGag197-205 peptide. Supernatants were then collected and assessed for IL-3 cytokine production, (A and B) represent the amount of IL-3 produced by HIV-specific CD8+ T cells as measured by IL-3 ELISA. Data represents pooled mean value for each immunization regime. The graphs (C and D) indicate IL-3 and GM-CSF percentage absorbance respectively, measured by antibody arrays as described in methods.