 |
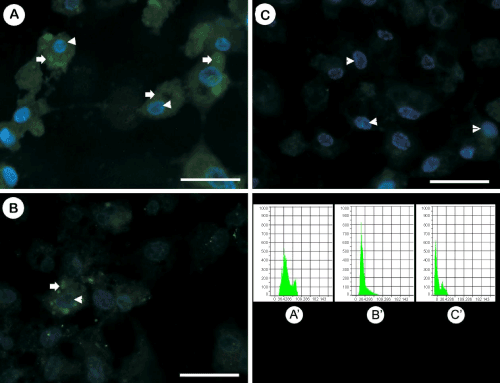
| Figure 4: Detection of viral E proteins by IFA (arrows) in transfected Vero cells and DAPI for nuclear contrast (arrow heads). (A) Positive immunofluorescence for expression of the dengue virus E protein (transfected with pCID2EtD3prM), (B) Positive immunofluorescence for dengue virus E protein expression (transfected with pCID2EtD2prM), (C) Negative immunofluorescence for dengue virus (transfected with pCI). Bar = 30 μm. Histograms quantitating the fluorescence intensity for dengue virus E protein in Vero cells. Figure A ‘: transfection with pCID2EtD3prM, B ‘: transfection with pCID2EtD2prM. C ‘: negative immunofluorescence (transfection with pCI). The X-axis indicates the fluorescence intensity, whereas the Y-axis indicates the number of pixels that demonstrate a given intensity. |