 |
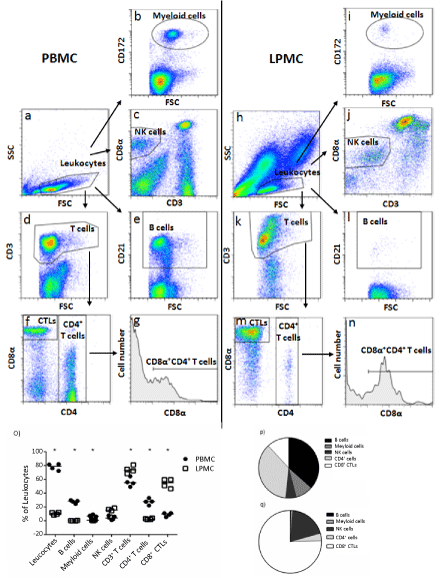
| Figure 4: Frequency of leukocyte subsets in PBMC and LPMC using FCM analysis A) shows a representative FCM analysis (n=4) from PBMCs (left) and LPMC (right) isolated from 6 week old pigs were analysed on the frequencies of different immune cell subsets using three-color FCM. Forward scatter (FSC) and side scatter (SSC) were used to gate on leukocytes (PBMCs (a) and LPMC (h) for further analysis of myeloid cells (CD172+; b and i), NK cells (CD3- CD8α+; c and j), B cells (CD21+; e and l) and T cells (CD3+; d and k). Gated T cells were then further analysed on their CD4/CD8α expression to determine the frequency of CTLs (CD4-CD8αhigh; f and m) and CD4+ T cells (f and m). CD8α expression of CD4+ T cells was also investigated to define the frequency of experienced CD4+ T cells (CD8α+CD4+; g and n). (o) Summarizes the results of this FCM analysis of all four analysed animals. Percentages from the PBMC population are represented by a closed circle and the percentages from the LPMC populations are represented by an open box. (p) and (q) is a pie chart showing the relative average percentage of PBMCs and LPMCs from all 4 animals. |