|
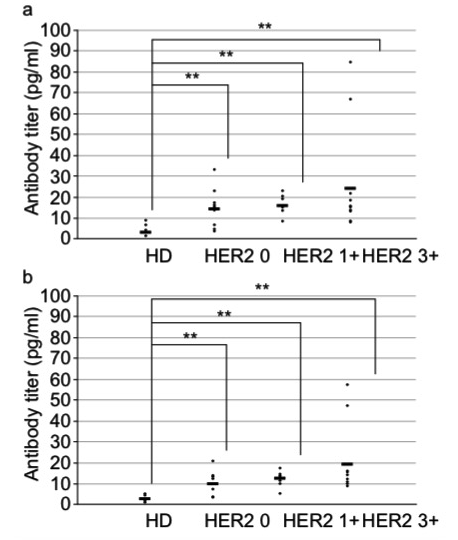
| Figure 4: Anti-CH401MAP antibody titer of supernatants obtained from peptide-stimulated PBMCs.Antibody titers (pg/ml) of the 3 patient groups (HER2 0, HER2 1+2+, and HER2 3+) and the healthy donor group (HD) are shown. Horizontal lines represent the mean titer of the groups and the dots represent individual sample titer. (A) Non-stimulated culture series and (B) CH104MAP-stimulated culture series. |