 |
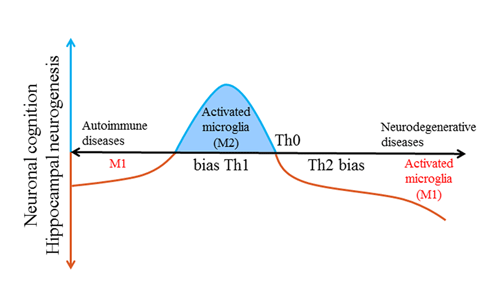
| Figure 1: A simplified diagram describing relations between hippocampal microglia phenotype, systemic Th1/Th2 bias and neurobehavioral functions under in terms of physiological conditions and pathological conditions. (a) Blue/red colors represent increased/decline in hippocampal neurogenesis, respectively. (b) Systemic Th1/Th2 cytokine balance correlates with hippocampal neurogenesis [8-10], followed by M2 (alternatively activated) or M1 (classically activated) polarization of microglia in the present study. (c) There is less likely exist a linear relationship between them on basis of continuous invasion of Th1 cells in autoimmune diseases involved with cognitive decline, although systemic Th1 bias is positively associated with increased in neural proliferation [35]. (d) Proper Th2 bias or strong Th2 inflammation is associated with cognitive decline [36]. |