 |
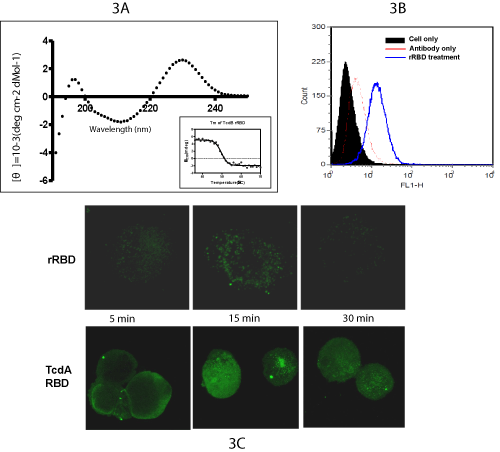
| Figure 3: (A) CD spectra of rRBD. (B) Vero cell binding ability of rRBD was characterized by flow-cytometry. (C) Immunofluoresence signals of rRBD and TcdA RBD binding to Vero cell were analyzed by confocal micrscopy after 5, 15 and 30 minutes rRBD inoculation. |