 |
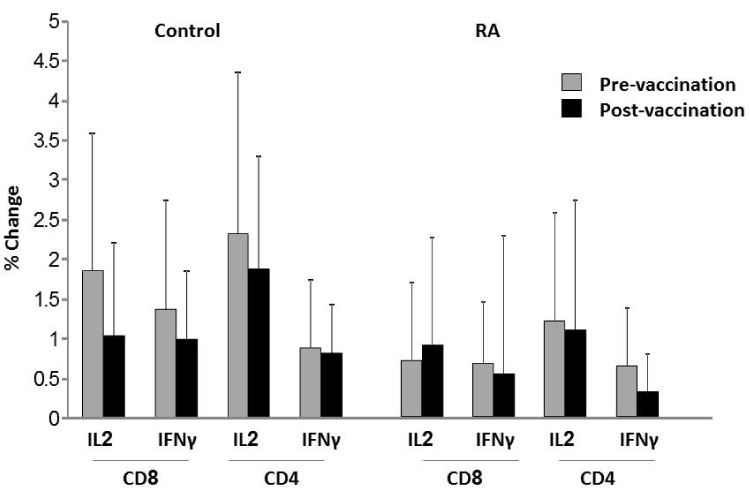
| Figure 1: Flow cytometric analysis of of Il-2- and IFNγ-producing CD4+/CD8+ cells. The flow cytometric analysis of CD4/CD8 T-cell cytokine production was analyzed before and 4 weeks after influenza vaccination. Percent (%) change was calculated as the percentage of CD69+/IFN-γ- and CD69+/IL-2-producing cells within the total CD8 and CD4 T cell population in the antigenstimulated cultures, subtracted by those in the negative control cultures. No difference in the frequencies of influenza specific activated cells was found in both groups, either before or 4 weeks following influenza vaccination (columns, mean; bars, SD). RA: Rheumatoid Arthritis. |