 |
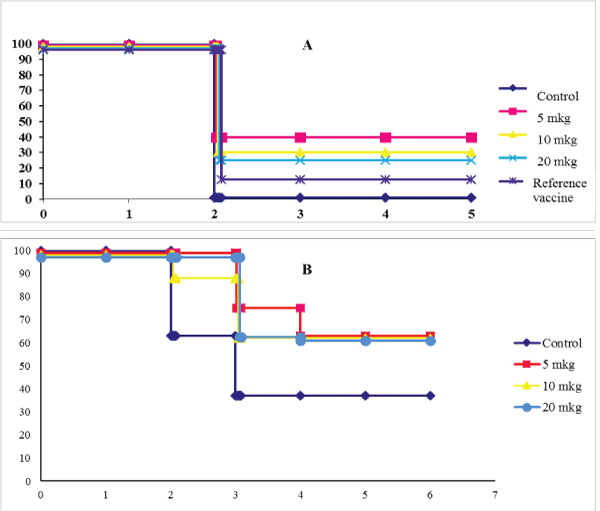
| Figure 5: Surviving of animals in different groups after infection. A. Surviving of animals in different groups after peritoneal infection. The X axis shows the time after infection (days), on an axis Y - survival rate of animals (%). Infection was induced with 3x10² CFU/mouse S. pneumoniae strain 442 (type 19F), B) Surviving of animals in different groups after intranasal infection. The X axis shows the time after infection (days), on an axis Y - survival rate of individuals (%). Infection was induced with 1 × 10⁷ CFU/mouse S. pneumoniae strain 73 (type 3). Each experimental group included 10 mice. |