 |
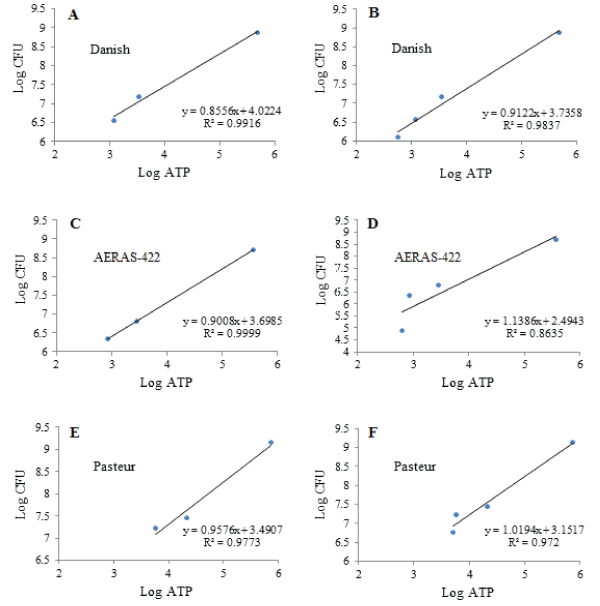
| Figure 5: Linear relationship between the CFU count and ATP concentration of the same BCG/r BCG strain. A, C and E were generated from the average results of 3 different dosage forms (bulk, HD and LD) for each strain; B, D and F were generated from addition of Extra-LD data for each strain (for original values refer to Table 2). |