|
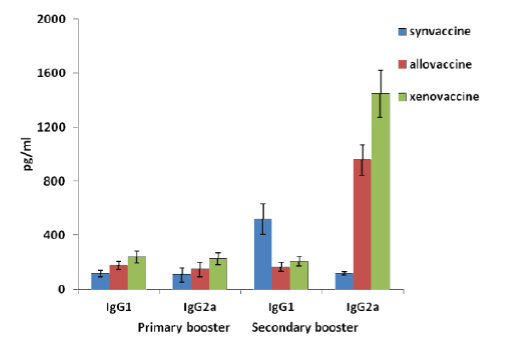
| Figure 4: Analysis of IgG subtypes in mice immunized with different forms of vaccines in response to whole cell lysate of macrophages infected with live C. neoformans. Sera obtained from various experimental groups after each booster were assayed individually by ELISA method. The level of IgG1 and IgG2a was expressed as pg/ml. Each bar represents the mean of three determinations ± S.D. |