 |
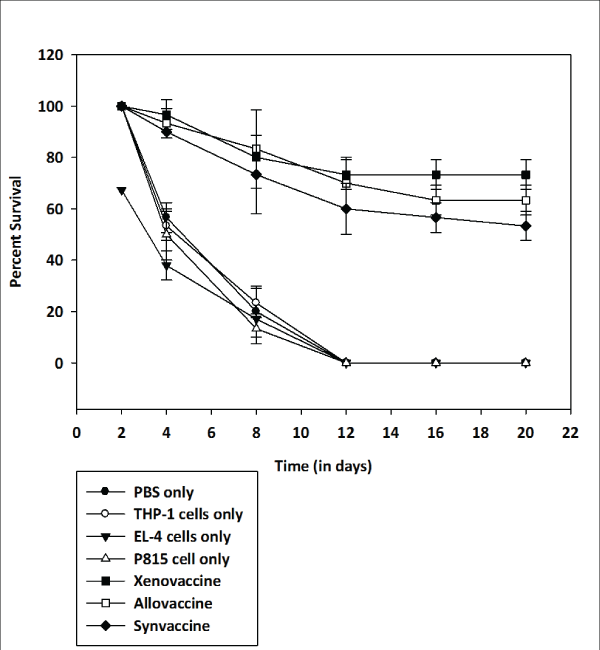
| Figure 7: Percent survival of animals in various immunized groups on different days post C. neoformans infection. Eight to ten mice were taken in each group and the survival rate observed after infection with live C. neoformans. The experiments repeated three times. Each point in the graph represents the mean of three determinations ± S.D. |